perf_event空指针导致卡死
问题描述
- 故障时间:2025-09-26 10:26:27
- 故障节点:四川CYUNOS替换支撑
- 故障现象:BUG: unable to handle kernel paging request at 000000046474e560
- 操作系统:4.19.90-2102.2.0.0068.ctl2.x86_64
- 硬件平台: Red Hat KVM, BIOS 1.13.0-2.ctl2 04/01/2014
问题分析
客户执行进程coroot-node-age的时候遇到系统卡死,vmcore-dmesg.txt中日志如下:
1
2
3
4
5
6
7
8
9
10
11
12
13
14
15
16
17
18
19
20
21
22
23
24
25
26
27
28
29
30
31
32
33
34
35
36
37
38
39
40
41
42
|
[26643577.142669] BUG: unable to handle kernel paging request at 000000046474e560
[26643577.142736] PGD ce7e61067 P4D ce7e61067 PUD 0
[26643577.142787] Oops: 0000 [
[26643577.142832] CPU: 2 PID: 2035425 Comm: coroot-node-age Kdump: loaded Not tainted 4.19.90-2102.2.0.0068.ctl2.x86_64
[26643577.142889] Hardware name: Red Hat KVM, BIOS 1.13.0-2.ctl2 04/01/2014
[26643577.142941] RIP: 0010:bpf_prog_array_copy+0x12/0x170
[26643577.142987] Code: 75 ef f3 c3 48 c7 00 e0 2f d2 8c c3 66 66 2e 0f 1f 84 00 00 00 00 00 90 0f 1f 44 00 00 48 85 ff 41 56 41 55 41 54 55 53 74 56 <48> 8b 47 10 4c 8d 47 10 48 85 c0 74 49 45 31 d2 31 db eb 25 45 31
[26643577.143092] RSP: 0018:ffffa2d0488e7dd8 EFLAGS: 00010206
[26643577.143138] RAX: ffff918ae27140d0 RBX: ffff918ad7843000 RCX: ffffa2d0488e7e08
[26643577.143191] RDX: 0000000000000000 RSI: ffffa2d046cc7000 RDI: 000000046474e550
[26643577.143248] RBP: 000000046474e550 R08: ffff918ad7843000 R09: 0000000000000000
[26643577.143297] R10: ffff918ade6f0000 R11: 0000000000000000 R12: ffff918c2c7c6408
[26643577.143345] R13: ffff918ad7843000 R14: ffffa2d0488e7c00 R15: ffff918ad7843258
[26643577.143405] FS: 00007ff6eeffd640(0000) GS:ffff91903fa80000(0000) knlGS:0000000000000000
[26643577.143456] CS: 0010 DS: 0000 ES: 0000 CR0: 0000000080050033
[26643577.143539] CR2: 000000046474e560 CR3: 0000000ae8466004 CR4: 0000000000760ee0
[26643577.143591] DR0: 0000000000000000 DR1: 0000000000000000 DR2: 0000000000000000
[26643577.143644] DR3: 0000000000000000 DR6: 00000000fffe0ff0 DR7: 0000000000000400
[26643577.143695] PKRU: 55555554
[26643577.143735] Call Trace:
[26643577.143790] perf_event_detach_bpf_prog+0x4c/0xc0
[26643577.143827] _free_event+0xd2/0x3a0
[26643577.143839] perf_event_release_kernel+0x201/0x350
[26643577.143854] perf_release+0xc/0x10
[26643577.143866] __fput+0xe2/0x210
[26643577.143880] task_work_run+0x8a/0xb0
[26643577.143894] exit_to_usermode_loop+0xd3/0xe0
[26643577.143908] do_syscall_64+0x1a3/0x1d0
[26643577.143921] entry_SYSCALL_64_after_hwframe+0x44/0xa9
[26643577.143940] RIP: 0033:0x1f8ecee
[26643577.143951] Code: 24 28 44 8b 44 24 2c e9 70 ff ff ff cc cc cc cc cc cc cc cc cc cc cc cc cc cc cc cc 49 89 f2 48 89 fa 48 89 ce 48 89 df 0f 05 <48> 3d 01 f0 ff ff 76 15 48 f7 d8 48 89 c1 48 c7 c0 ff ff ff ff 48
[26643577.144015] RSP: 002b:000000c00136d7d8 EFLAGS: 00000202 ORIG_RAX: 0000000000000003
[26643577.144036] RAX: 0000000000000000 RBX: 000000000000015b RCX: 0000000001f8ecee
[26643577.144055] RDX: 0000000000000000 RSI: 0000000000000000 RDI: 000000000000015b
[26643577.144080] RBP: 000000c00136d818 R08: 0000000000000000 R09: 0000000000000000
[26643577.144100] R10: 0000000000000000 R11: 0000000000000202 R12: 000000c00136d868
[26643577.144118] R13: 0000000000000000 R14: 000000c000104fc0 R15: 0000000000000000
[26643577.144138] Modules linked in: tcp_diag udp_diag raw_diag inet_diag unix_diag af_packet_diag netlink_diag nfnetlink_queue binfmt_misc xt_state xt_iprange xt_set xt_multiport iptable_raw ip_set_hash_ip ip_set_hash_net ip_set ipip tunnel4 ip_tunnel veth xt_recent xt_nat xt_statistic ipt_REJECT nf_reject_ipv4 ip_vs_sh ip_vs_wrr ip_vs_rr ip6table_nat nf_nat_ipv6 ip6_tables iptable_mangle xt_comment xt_mark ipt_MASQUERADE nf_conntrack_netlink nfnetlink iptable_nat nf_nat_ipv4 xt_addrtype iptable_filter xt_conntrack nf_nat br_netfilter bridge stp llc rfkill ipmi_devintf ipmi_msghandler overlay nf_conntrack_ftp intel_rapl_msr intel_rapl_common isst_if_common xfs nfit qxl libnvdimm ttm crct10dif_pclmul drm_kms_helper crc32_pclmul syscopyarea ghash_clmulni_intel sysfillrect sysimgblt fb_sys_fops drm i2c_piix4
[26643577.147631] virtio_balloon joydev pcspkr ip_vs nf_conntrack nf_defrag_ipv6 nf_defrag_ipv4 libcrc32c ip_tables ext4 mbcache jbd2 ata_generic crc32c_intel serio_raw virtio_blk virtio_net net_failover ata_piix failover dm_mirror dm_region_hash dm_log dm_mod
[26643577.149675] CR2: 000000046474e560
|
代码分析
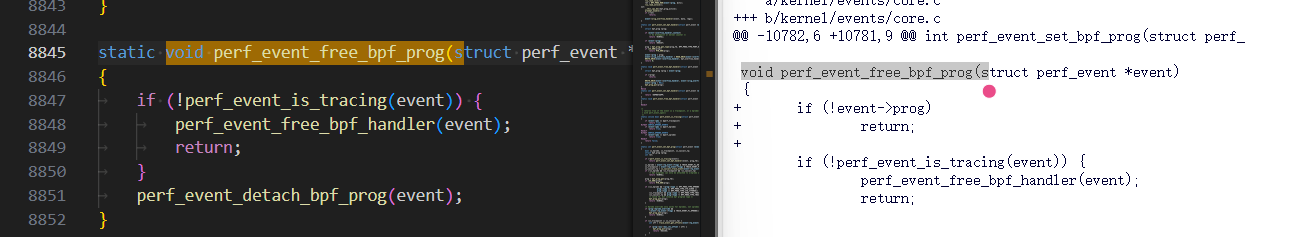
crash 解析vmcore ip指针可以看到8847行的if解引用存在内核态非法访问用户态地址可能,会导致内核卡死。
解决方案
上游修复方案:https://lore.kernel.org/all/20241104135518.978956692@infradead.org/
主要逻辑如下:
主题: [PATCH 13/19] perf: 强化 perf_event_free_bpf_prog() 的健壮性
确保 perf_event_free_bpf_prog()在第二次被调用时是安全的;特别是在没有剩余 BPF 程序时,避免引用 event->pmu。
XXX perf_event_detach_bpf_prog()可能会留下一个悬空的 event->prog。