性能调优
本文最后更新于:2025年7月25日 下午
性能调优
性能优化
ltrace
strace
ftrace
ftrace hook
grub 配置中启用 ftrace
在 grub 配置中启用 ftrace 的核心目的是
在系统启动的最早阶段捕获关键内核事件(如内存分配、驱动初始化等),尤其针对那些在用户态工具(如
perf 或动态 ftrace
命令)可用之前发生的底层问题。以下是具体场景和优势:
- 早期启动故障(如 CMA 初始化失败)
- 硬件兼容性问题(如 DMA 驱动崩溃)
- 性能瓶颈分析(如内存分配延迟)
以下是 grub 配置中启用 ftrace function 追踪
cma_alloc
的完整总结,涵盖参数配置、调试技巧和验证步骤:
1. 修改 grub 配置
编辑 /etc/default/grub 文件:
1 | |
在 GRUB_CMDLINE_LINUX 行追加以下参数:
1 | |
完整示例:
1 | |
set_ftrace_filter
在 Linux 内核的 ftrace
系统中,set_ftrace_filter 文件的语法和
GRUB 内核参数的语法
对多函数输入的格式要求不同,这是由两者的设计差异导致的。以下是详细解释:
1. 语法差异的原因
| 场景 | 分隔符 | 设计逻辑 |
|---|---|---|
| GRUB 内核参数 | 逗号 (,) |
遵循 Linux 内核启动参数的通用规范(与
modprobe、sysfs 等参数风格一致) |
set_ftrace_filter 文件 |
冒号 (:) |
ftrace 子系统内部实现约定(历史原因,与正则表达式过滤器兼容) |
2. 正确用法示例
(1) 在 GRUB 中配置(逗号分隔)
1 | |
(2) 在运行时写入
set_ftrace_filter(冒号分隔)
1 | |
3. 底层实现原理
GRUB 参数解析:
内核在解析启动参数时,会将ftrace_filter=cma_alloc,dma_alloc,...自动转换为cma_alloc dma_alloc ...的列表形式传递给 ftrace。ftrace 文件接口:
set_ftrace_filter文件通过:分隔多个函数名,因其内部使用strsep()函数按:切分字符串。
2. 更新 GRUB 并重启
1 | |
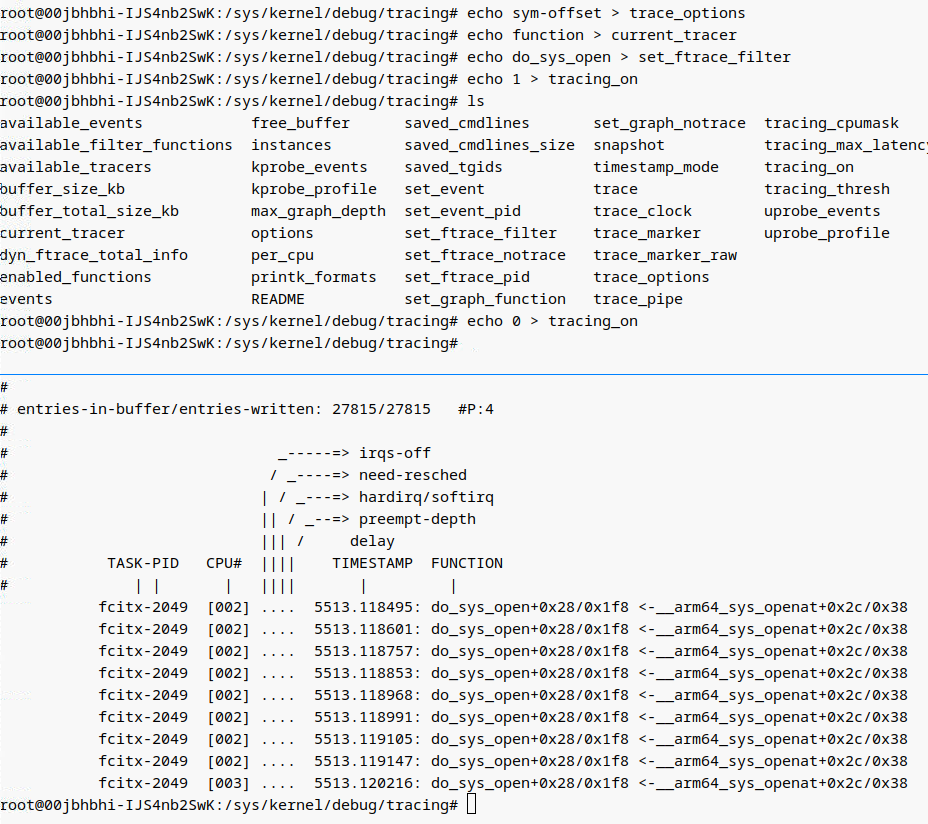
3. 启动后验证配置
(1) 检查 ftrace 状态
1 | |
(2) 确认追踪选项
1 | |
输出应包含:
1 | |
4. 查看追踪日志
(1) 实时监控
1 | |
输出示例:
1 | |
(2) 保存日志
1 | |
5. 高级调试技巧
(1) 按进程过滤
1 | |
(2) 动态调整缓冲区
1 | |
(3) 捕获调用参数
1 | |
6. 关闭追踪
(1) 临时关闭
1 | |
(2) 永久关闭
移除 GRUB 中的 ftrace 相关参数并更新:
1 | |
7. 关键参数说明
| GRUB 参数 | 作用 | 等效运行时命令 |
|---|---|---|
ftrace=function |
启用函数追踪 | echo function > current_tracer |
ftrace_filter=cma_alloc |
仅追踪 cma_alloc |
echo cma_alloc > set_ftrace_filter |
trace_options=func_stack_trace |
显示调用栈 | echo 1 > options/func_stack_trace |
trace_buf_size=16M |
设置 ftrace 缓冲区大小 | echo 16384 > buffer_size_kb |
log_buf_len=16M |
扩大内核日志缓冲区(辅助分析) | 无直接运行时等效命令 |
8. 典型问题排查
Q1: 无追踪输出
检查:确认
cma_alloc符号存在:1
grep " cma_alloc" /proc/kallsyms解决:若符号被内联,需重新编译内核并禁用内联优化:
1
./scripts/config --disable CONFIG_OPTIMIZE_INLINING
Q2: 日志不完整
- 解决:增大
trace_buf_size(如32M)或减少追踪范围。
Q3: 性能下降
- 建议:生产环境中仅在调试时启用,完成后关闭。
通过以上配置,您可以在系统启动时自动开始高效追踪
cma_alloc 调用,精准定位内存分配问题!
trace-cmd
function_graph
使用场景:
如果想要分析内核函数调用的子流程(即本函数调用了哪些子函数,处理的流程如何),这时需要用到 function_graph 跟踪器,从字面意思就可看出这是函数调用关系跟踪。
1 | |
1 | |
trace-cmd record:用于记录内核中的跟踪数据。-p function_graph:使用function_graph追踪器,记录函数的调用路径,显示每个函数的进入和退出时间,便于分析函数执行顺序和耗时。-g vfs_statx:指定要跟踪的内核函数,这里是vfs_statx,用于获取文件的元数据(类似于stat系统调用)。ls /runtime-mnt/alluxio/default/hbase3/alluxio-13:运行ls命令,列出指定目录的内容,这会触发vfs_statx函数。
1. 同时追踪多个函数
1 | |
示例:
1 | |
2. 查看结果
1 | |
3. 关键选项
-p function_graph:显示调用关系(推荐)
-g:指定要追踪的函数(可接多个)
--func-stack:记录调用栈(需手动添加)
-b 8192:设置缓冲区大小(单位 KB,如 8MB)
4. 注意事项
- 符号可见性:先确认函数可追踪(
trace-cmd list -f 函数名)
- 性能:追踪的函数越多,开销越大(建议 ≤10 个)
- 生产环境:建议用
-b增大缓冲区,避免丢数据
一句话总结:
用 trace-cmd record -p function_graph -g 函数1 -g 函数2
即可同时追踪多个函数,报告用 trace-cmd report 查看。
function
使用场景:
前面我们获得了内核函数的调用,但是有些场景我们更可能希望获取调用该内核函数的流程(即该函数是在何处被调用),这需要通过设置 options/func_stack_trace 选项实现。
以下是 将 GRUB 的 ftrace 配置转换为 trace-cmd
命令的完整方案,包括参数对应关系、使用方法和注意事项:
1. GRUB 参数与
trace-cmd 的对应关系
| GRUB 参数 | 等效的 trace-cmd 命令 | 说明 |
|---|---|---|
ftrace=function |
-p function |
启用函数追踪模式 |
ftrace_filter=cma_alloc |
-l cma_alloc |
仅追踪 cma_alloc 函数 |
trace_options=func_stack_trace |
--func-stack |
记录调用堆栈 |
trace_buf_size=16M |
-b 16384 (单位: KB) |
设置缓冲区大小为 16MB |
log_buf_len=16M |
无直接对应(内核日志独立) | trace-cmd 不控制内核通用日志缓冲区 |
2. 完整转换示例
原始 GRUB 配置
1 | |
等效的 trace-cmd 命令
1 | |
3. 执行流程
(1) 开始记录
1 | |
- 说明:
命令会阻塞当前终端,直到按Ctrl+C停止记录,数据将保存到cma_trace.dat。
(2) 触发 CMA 分配
在另一个终端执行可能触发 cma_alloc 的操作,例如:
1 | |
(3) 停止记录
按 Ctrl+C 终止 trace-cmd record。
4. 查看结果
(1) 直接读取报告
1 | |
输出示例:
1 | |
(2) 生成统计信息
1 | |
输出包括事件数量、缓冲区使用情况等。
5. 高级用法
(1) 追踪多个函数
1 | |
(2) 过滤进程 PID
1 | |
(3) 捕获函数参数
1 | |
6. 与 GRUB 方案的对比
| 特性 | GRUB + ftrace | trace-cmd |
|---|---|---|
| 启动阶段追踪 | ✅ 从内核最早阶段记录 | ❌ 需用户态启动后执行 |
| 自动化 | ✅ 无需人工干预 | ❌ 需手动触发命令 |
| 灵活性 | ❌ 重启后才能修改配置 | ✅ 可动态调整参数 |
| 数据持久化 | 需额外配置(如 systemd 服务) | ✅ 直接保存到文件 |
| 开销控制 | 依赖 trace_buf_size |
✅ 精细控制缓冲区、过滤条件 |
7. 生产环境建议
- 调试启动问题:优先用 GRUB +
ftrace(捕获早期事件)。
- 运行时调试:用
trace-cmd(灵活且低侵入性)。
- 长期监控:结合两者:
- GRUB 中配置基础过滤和缓冲区。
- 系统启动后通过
trace-cmd动态追加规则。
总结
将 GRUB 的 ftrace 配置转换为 trace-cmd
的命令时,核心映射关系为:
ftrace_filter=cma_alloc→-l cma_allocfunc_stack_trace→--func-stacktrace_buf_size=16M→-b 16384
trace-cmd 更适合 动态调试,而 GRUB
方案用于
启动阶段的问题捕获。两者互补可覆盖全生命周期的调试需求。
perf
-
1
2
3
4
5
6sudo apt install linux-perf
git clone https://github.com/brendangregg/FlameGraph.git
cd FlameGraph
sudo perf record -F 99 -p 512318 -g -- sleep 30
sudo perf report -i perf.data
sudo perf script | ./stackcollapse-perf.pl | ./flamegraph.pl > WXWork.exe.svg
perf 基本使用
1 | |
perf record
1 | |
1 | |
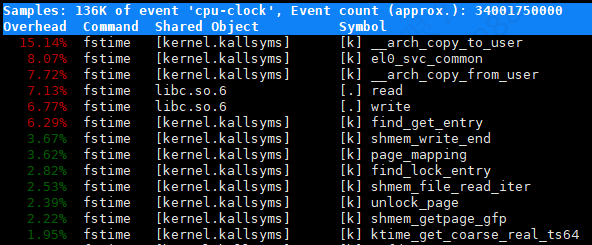
在 perf report 输出中,数据的各列信息如下:
- Overhead:表示每个函数在所有采样中占用的 CPU 时间百分比。
- Command:表示执行该函数的命令或进程名(例如
fstime)。 - Shared
Object:表示函数所在的共享库或二进制文件(例如
[kernel.kallsyms]表示内核,libc.so.6表示 C 标准库)。 - Symbol:表示函数的名称(例如
__arch_copy_to_user、read、write)。
简单总结
__arch_copy_to_user:占用 15.14% 的 CPU 时间。el0_svc_common:占用 8.07% 的 CPU 时间。__arch_copy_from_user:占用 7.72% 的 CPU 时间。read:占用 7.13% 的 CPU 时间。write:占用 6.77% 的 CPU 时间。
选择某一行深入分析
移动键盘上下键选择第一行__arch_copy_to_user,然后按enter。
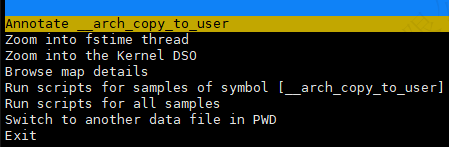
1 | |
在 perf report 中,可以执行以下操作:
- Annotate
__arch_copy_to_user:查看__arch_copy_to_user函数的汇编代码级别性能注释。 - Zoom into
fstimethread:查看fstime线程的详细性能数据。 - Zoom into the Kernel DSO:查看内核共享对象的详细性能数据。
- Browse map details:查看地址映射的详细信息。
- Run scripts for samples of symbol
[__arch_copy_to_user]:对
__arch_copy_to_user符号的样本运行分析脚本。 - Run scripts for all samples:对所有样本运行分析脚本。
- Switch to another data file in PWD:切换到当前目录中的另一个数据文件。
Kernel DSO
在 perf report 中,Kernel DSO(Dynamic
Shared
Object)指的是内核的共享对象或模块,它是内核的运行时组件。具体来说:
Kernel DSO:在内核空间中,虽然内核本身不是一个传统意义上的共享库,但内核的功能和符号可以被视作类似于动态共享对象。在性能分析中,Kernel DSO 表示内核的各个部分(如模块、驱动程序等),这些部分在执行期间动态地被加载到内存中。
使用场景:在性能分析中,你可以查看 Kernel DSO 的详细数据,以了解内核模块或驱动程序的性能表现,找出性能瓶颈或潜在问题。
简单总结:
- Kernel DSO 是指在内核空间动态加载的共享对象或模块,用于分析内核部分的性能。
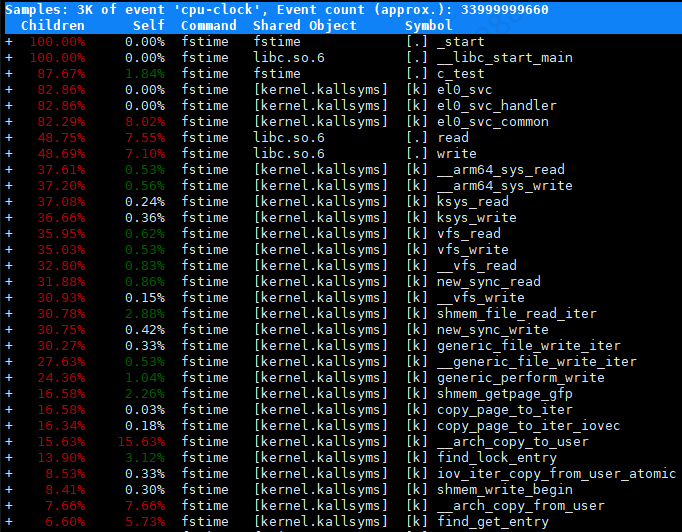
perf record -F 99 -g
1 | |
-F 99:设置采样频率为 99 Hz。-g:捕获调用栈信息。
1 | |
perf report 中各列的含义如下:
- Children:函数及其子函数的总 CPU 时间占比。
- Self:函数自身的 CPU 时间占比。
- Command:执行的命令或进程名。
- Shared Object:函数所在的库或二进制文件。
- Symbol:函数名称。
性能采集小工具
获取自制性能采集小工具:
1 | |
重新加载systemd配置:
1 | |
开机自动启动且立马启动性能采集服务:
1 | |
查看性能采集服务状态:
1 | |
查看性能采集服务日志:
1 | |
关闭性能采集服务:
1 | |
禁止性能采集服务开机自动启动:
1 | |
收集日志:
/var/log:系统日志
/var/log/iostat:实时报告系统的磁盘 I/O 统计信息
/var/log/pidstat:找到 IO 占用高的进程
/var/log/top:实时报告系统的进程资源占用
/var/log/perf:实时报告系统的性能热点
perf实践
hcache
eBPF
bpftrace
1 | |
您提供的命令是使用 bpftrace 工具来跟踪信号生成事件,并打印相关信息。让我解释一下这个命令的含义:
bpftrace:是一个强大的跟踪和探查工具,它使用BPF(Berkley Packet Filter)技术来提供对内核和用户空间的动态跟踪能力。
-e:这是 bpftrace 命令的选项,用于指定要执行的跟踪程序。
'tracepoint:signal:signal_generate { printf("Process %d %s send SIGNAL %d to process %d %s", pid, comm, args->sig, args->pid, args->comm); }':这是要执行的 bpftrace 跟踪程序。
跟踪程序的含义是:当信号生成事件(signal_generate)发生时,打印相关信息。具体来说,它打印了发送信号的进程的进程ID(pid)、进程名称(comm),以及接收信号的进程的进程ID(args->pid)和进程名称(args->comm)。
这个命令可以帮助您跟踪信号的生成情况,并提供有关发送和接收信号的进程信息。您可以根据需要修改打印的信息或添加其他的跟踪逻辑来满足您的需求。请注意,使用 bpftrace 跟踪程序需要在支持BPF的内核版本上运行,并具有足够的权限。
SIGTERM
专门追踪信号:SIGTERM (15):
1 | |
专门追踪信号:SIGTERM (15)并输出到sigterm.log:
1 | |
oom
追踪OOM Killer事件:
1 | |
追踪kprobe:vhost_work_queue:
1 | |
pstack
method tracing
Grafana
安装环境:
1 | |
由于主机9090端口被占用,故通过systemd启动prometheus时需要更改一下端口为9999:
1 | |
开启自启:
1 | |
登录grafana:
1 | |
Add your first data source:
选择Prometheus
Connection
Prometheus server URL *填入下方url:
1 | |
跳到最下方点击Save & test即可。
Create your first dashboard:
Import dashboard填入下方链接(本机为deepin 20.9,不支持最新版本的Node Exporter Full,建议使用下方链接):
1 | |
也可通过id导入,建议id:
1 | |
prometheus-alertmanager暂未配置。
- Install Grafana on Debian or Ubuntu
- 分分钟搞定Grafana(图文详解)
- CentOS7搭建prometheus 监控Linux主机
- Node Exporter Full
unixbench
https://github.com/kdlucas/byte-unixbench/tree/master
1
git clone https://github.com/kdlucas/byte-unixbench.git
-
1
2
3cd ~/byte-unixbench-5.1.3/UnixBench
mount -o size=2G -t tmpfs none tmp